Home Dataset Methods and Results Analysis

Methods and Results

Classifiers

We used Weka to experiment with different classifiers and identify which would perform best. Using 10-fold cross-validation on the entire dataset, the accuracies of each classifier are displayed in the following table. We chose the following classifiers because they can be used to map continuous input attributes to categorical classifications, and we learned about how they work from EECS 349 lecture/assignments.
Classifier Accuracy (%)
ZeroR 16.7
k Nearest Neighbor 59.3
Decision Tree (J48) 57.9
Random Forest 73.5
Multilayer Perceptron 68.8
Logistic Regression 72.1
BayesNet 67.7
Naive Bayes 63.2

10-fold cross-validation accuracy for various learners. k Nearest Neighbor has peak accuracy at k=6, which is shown in the table.

ZeroR gives a baseline accuracy to compare other classifiers. It is a helpful baseline because it assigns classifications based on the the most common classification value, essentially creating a measure of minimal performance. Also, it should be noted that ZeroR is only slightly better than randomly guessing, where there is only a 1/7 chance of guessing correctly; this is because the training data was balanced for each genre.
Random forests are an ensemble learning method that involves constructing a number of individual decision trees and averaging their results. These classifiers use bagging and random selection of features to generate highly accurate models. Bagging also reduces overfitting in these trees.

Results

After identifying that random forest was the best classifier of the ones we investigated, we implemented it in in Python using the Sklearn package to further explore its classification abilities as well as have a savable model to put on our project website. We analyzed how accuracy changed as we increased dataset from 46 to 1,296. The learning curve for accuracy against dataset size is shown below. The plot shows that after about 600 data entries, the accuracy starts to plateau.
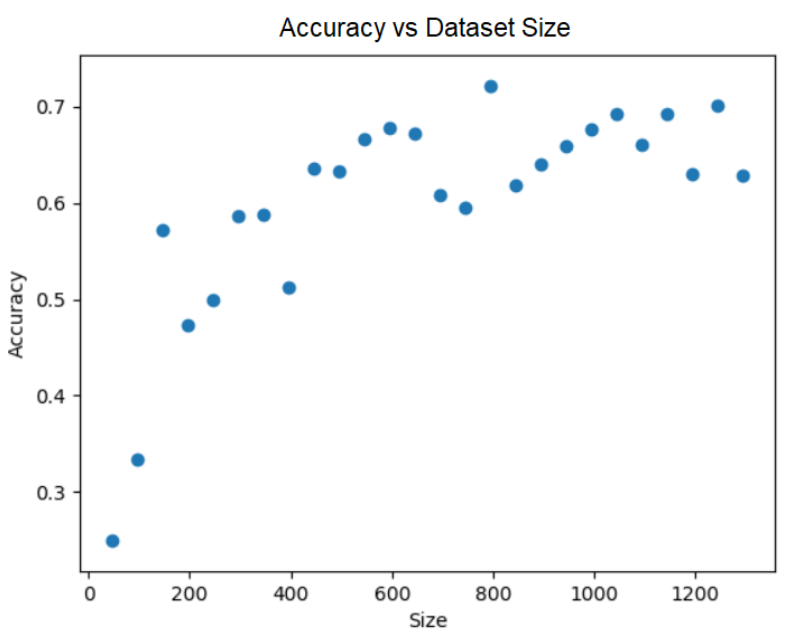
learning curve

Accuracy of our model as the dataset size increases

Understandably, lots of the inaccuracy is due to overlap between similar genres like pop and edm, hip-hop/rap and r&b, etc. These misclassifications can be seen below in the confusion matrix for the random forest classifier. For example, 30 (out of 170) r&b songs were misclassified as hip-hop/rap.
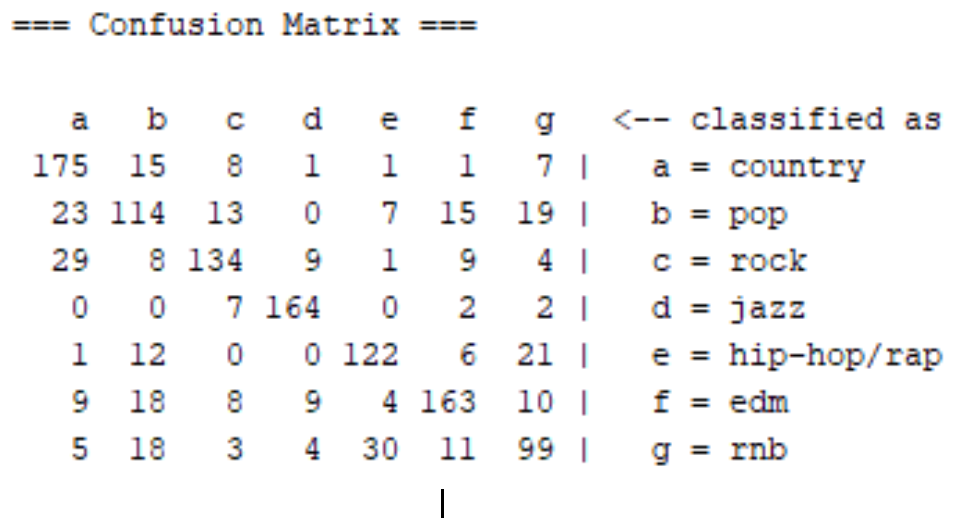
matrix

Genre classification confusion matrix

Featuring another artist of a different genre in a song also leads to misclassifications. For instance, a pop song may be classified as hip hop if it features a rap artist who contributes a verse or two.

Northwestern University EECS 349