HW2: Measuring
the sensor noise of your Tegra tablet (15 Points)
Due: Thursday
10/12 at 11:59pm
EECS 395/495: Introduction
to Computational Photography
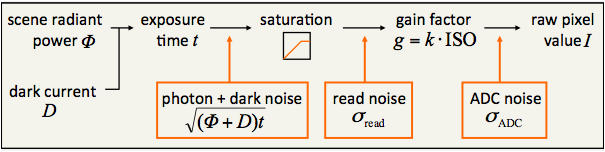
The sensor noise model discussed in the lectures. In this homework assignment, we will measure the photon, read, and ADC noise.
The
goal of this homework is to measure and characterize the temporally varying
noise properties of the camera on your Tegra tablet. In particular, we are
going to compare the signal-dependent (photon) and signal-independent (read,
ADC) noise. For the purposes of
this homework, the brightness value for the ith
pixel is modeled as:
![]() (1)
(1)
where ![]() is the power incident on the
ith pixel (measured in
photo-electrons/sec), t is the
exposure time, g is the camera
sensitivity (measured in gray levels/photo-electron), and
is the power incident on the
ith pixel (measured in
photo-electrons/sec), t is the
exposure time, g is the camera
sensitivity (measured in gray levels/photo-electron), and ![]() is the noise at the ith
pixel. Note that this equation relates a physical quantity (photons) to the
digital number stored in a photograph.
is the noise at the ith
pixel. Note that this equation relates a physical quantity (photons) to the
digital number stored in a photograph. ![]() will fluctuate
with time due to noise. However, if we capture N images and average the signal over all measurements, we will get
a result that is very close to the desired brightness
will fluctuate
with time due to noise. However, if we capture N images and average the signal over all measurements, we will get
a result that is very close to the desired brightness
![]() (2)
(2)
The
variance in the measurements is a characterization of the noise in the sensor
and is given by
![]() (3)
(3)
Note
that each pixel in the image will have a different mean ![]() and variance
and variance ![]() . Our goal will be to
calculate these values. There are two components to this homework:
. Our goal will be to
calculate these values. There are two components to this homework:
1. Write android code to
capture a sequence of images (5 Points)
You
will gather sensor noise data by capturing a sequence of images of a static
scene. Since the scene brightness will not changed between captured photos,
variations in the measured brightness must be due to sensor noise.
You
will need to write a program to capture a sequence of images on your tegra
tablet. Here are some guidelines:
1.
Using the backbone code we provided in hw1. Hint: Look for the TODO:hw2 stubs.
2.
Make sure that you don't have any fluorescent lamps lighting your
scene. The light output of these lamps actually varies as a function of time,
albeit at very high frequencies that we can't perceive.
3.
Make sure that your scene contains a relatively wide range of
brightness values. Ideally your scene will contain at least one pixel with each
possible brightness value between 0-255. For instance, your scene can simply be
a print of the following ramp pattern

Figure 1: A ramp pattern generated in
Matlab using repmat(linspace(0, 1, 255),[255 1])
4.
Capture images in the raw file format. Note that this means the bayer pattern will be visible in the images, but you can
ignore this.
5.
Capture ~ 50 images of the scene
6.
Repeat this experiment twice for two different camera sensitivity
settings(gain), first set the sensitivity(gain) to the minimum setting, and
then the maximum setting.
2. Process the image
sequence to gather noise statistics (10 Points)
Now
that you have captured a sequence of images, you will need to download them
from your device and load them into Matlab. Now write
Matlab code to perform the following functions:
1.
To load the raw images into MATLAB, you only need to do : t = Tiff(filename,'r')
im = read(t). And then im will be the image input. Note: if the image is too large you can sample a part of them (using crop for im) in matlab.
2.
For each pixel, you captured a sequence of measurements. Plot a
histogram of these pixel values for a given pixel (you can use MATLAB's built
in function hist).
This plot serves as an estimate of the Probability Distribution Function (PDF)
for the noise. Create a few plots for different pixels. What do you observe
about the PDF? What is its approximate shape?
3.
Use equations (2) and (3) to calculate the mean ![]() and variance
and variance ![]() for each pixel in the image. Do this
separately for each experiment (i.e. for the different gain settings). Include
a figure that shows both the mean and variance images, as well as a few of the
original images you captured.
for each pixel in the image. Do this
separately for each experiment (i.e. for the different gain settings). Include
a figure that shows both the mean and variance images, as well as a few of the
original images you captured.
4.
Plot the variance as a function of the mean for each experiment. Before
you do this, first round the mean values to the nearest integer. There will
then likely be several pixels that have the same mean value. Calculate the
average variance for this mean value. Recall from class that the noise variance
should consist of photon, read, and ADC noise and obey the following model:
![]() (4)
(4)
![]() (5)
(5)
So we expect
that when we plot the variance vs. the mean the result will be a straight line
where the slope is the camera gain g.
5.
For each experiment, fit a line to the plotted data. You can do this
using the built-in MATLAB function polyfit. For
example, if your mean values are stored in a vector x and your variance values are stored in a vector y, your function call would be p = polyfit(x,y,1).
6.
Use your fitted line data to calculate the camera gain g, the read noise variance ![]() (measured in photo-electrons), and the
ADC noise variance
(measured in photo-electrons), and the
ADC noise variance ![]() (measured in gray levels).
(measured in gray levels).
7.
Signal-to-Noise Ratio (SNR) is a measure of the quality of captured
images. It is usually defined as the ratio of signal mean to its standard
deviation.
![]() (6)
(6)
Plot the SNR as
a function of mean pixel value. What is your interpretation of this plot? How
does it relate to the three types of noise from equations (4) and (5)? What is
the maximum SNR that can be achieved by the Tegra camera?
What to Submit:
Submit
a zip file to the dropbox, which includes
1.
A write-up document that explains what you did, what the results are,
and what problems you encountered.
2.
All code that you wrote, including the android code running on the Tegra
tablet, and the Matlab code to evaluate the noise
statistics.
3.
The write-up should include all the figures that you were instructed to
generate, and should answer all the questions posed in this document.
Problems you might encounter:
im2uint8(im) function