Analysis of Chicago Hospitals for Variations in Hospital Billing and Medicare Payments
Northwestern University
{ankitag,choudhar}@eecs.northwestern.edu
This work is a sequel to our earlier study published as a paper at KDD DMH 2013. Our goal here is to study the variation in the charges of and payments to 27 hospitals in Chicago. We rank 100 health conditions (DRGs) and 27 Chicago hospitals in different ways to discover interesting insights.
We present below heat maps of data for Chicago Hospitals to make a visual analysis of hospital charges for different conditions. The first map depicts the charges of various Chicago hospitals for different medical conditions. The second presents the Medicare payments made to the hospitals for those conditions while the last shows normalized hospital charges (normalization procedure defined in our paper). Red cells are on the highest end (relatively the most expensive) compared to the US average while blue cells are on the lowest (relatively the cheapest). Yellow cells are on par with the US average. White cells imply that our dataset did not have the corresponding hospital-condition data.
Chicago Hospital Heat Maps
Hospital Billing | Medicare Payments | Normalized Hospital Billing |
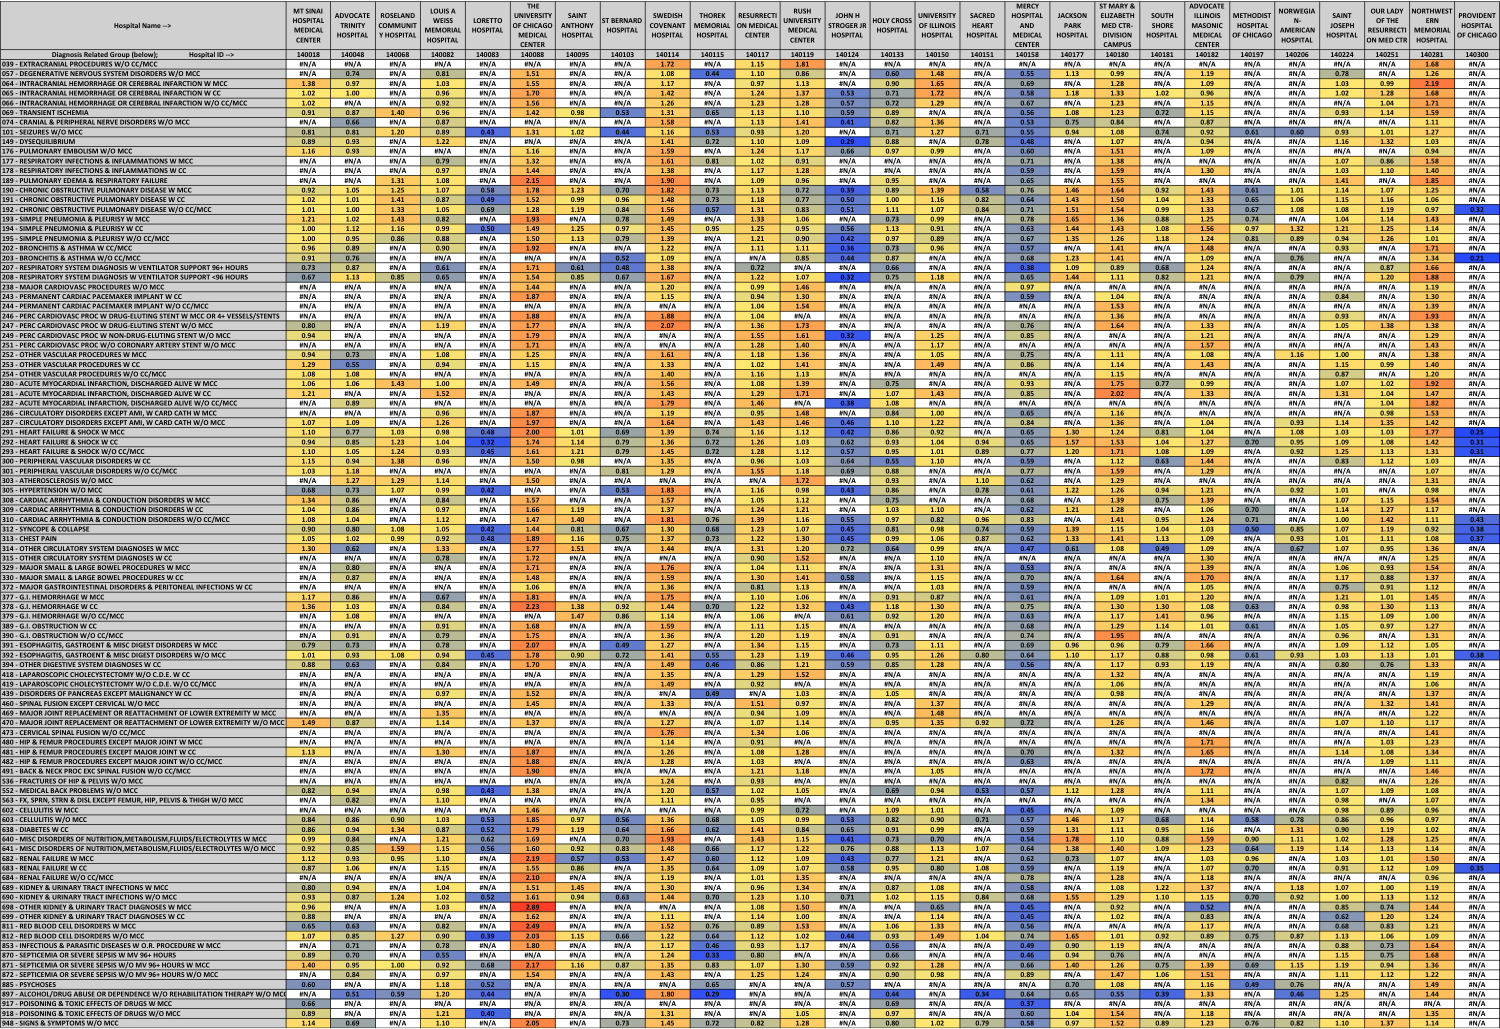 |
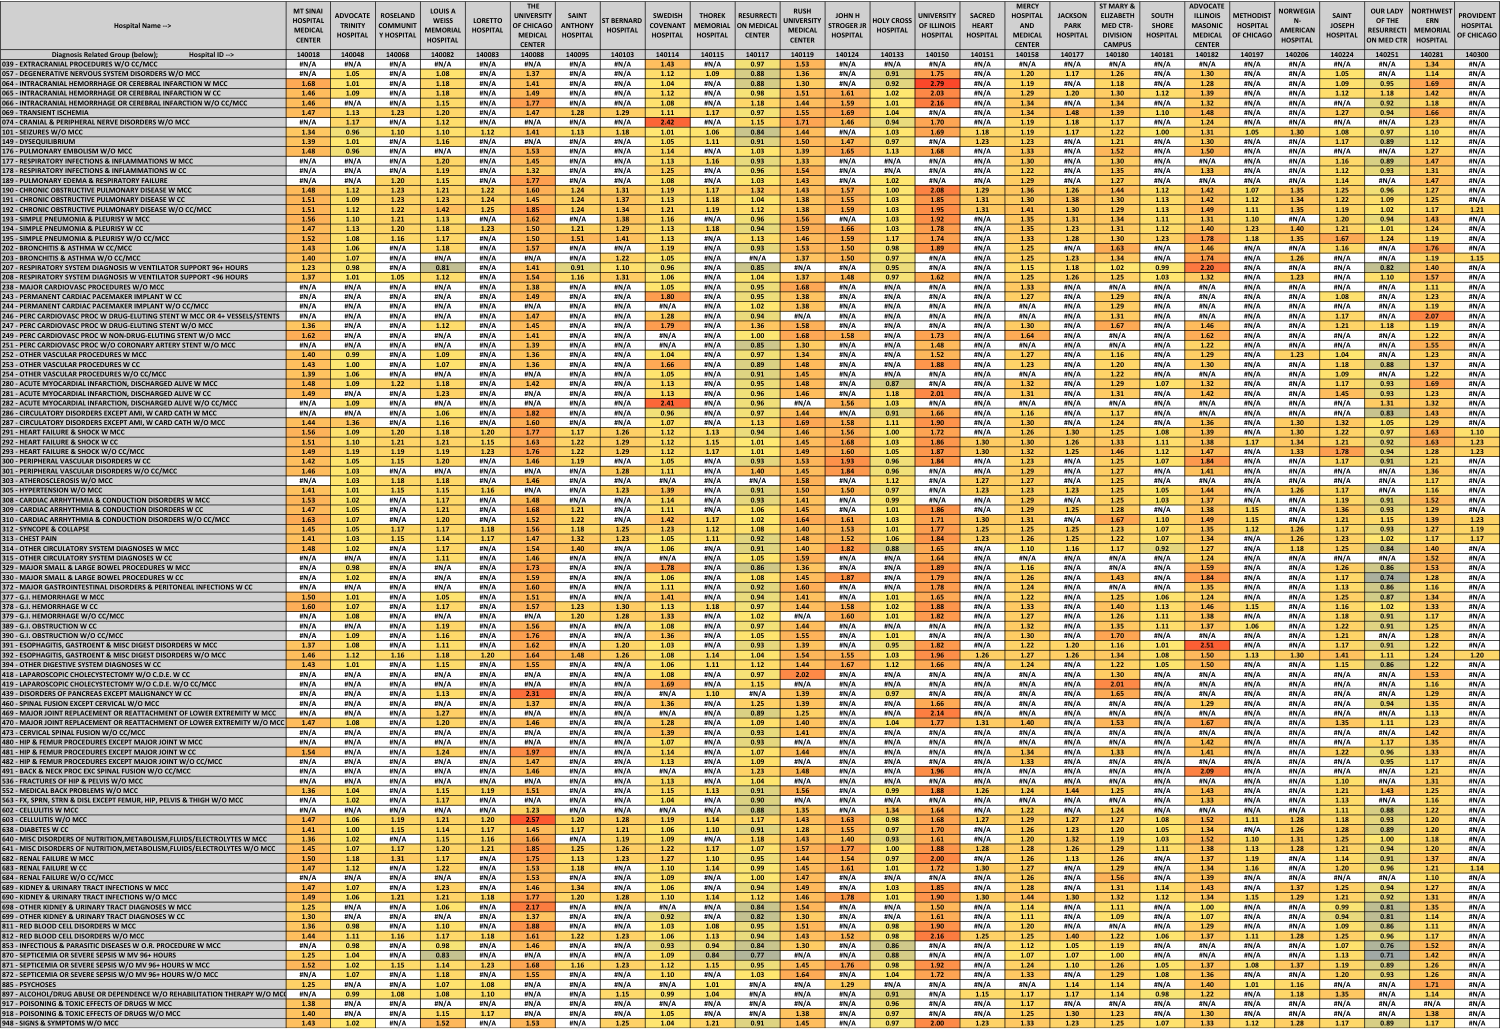 |
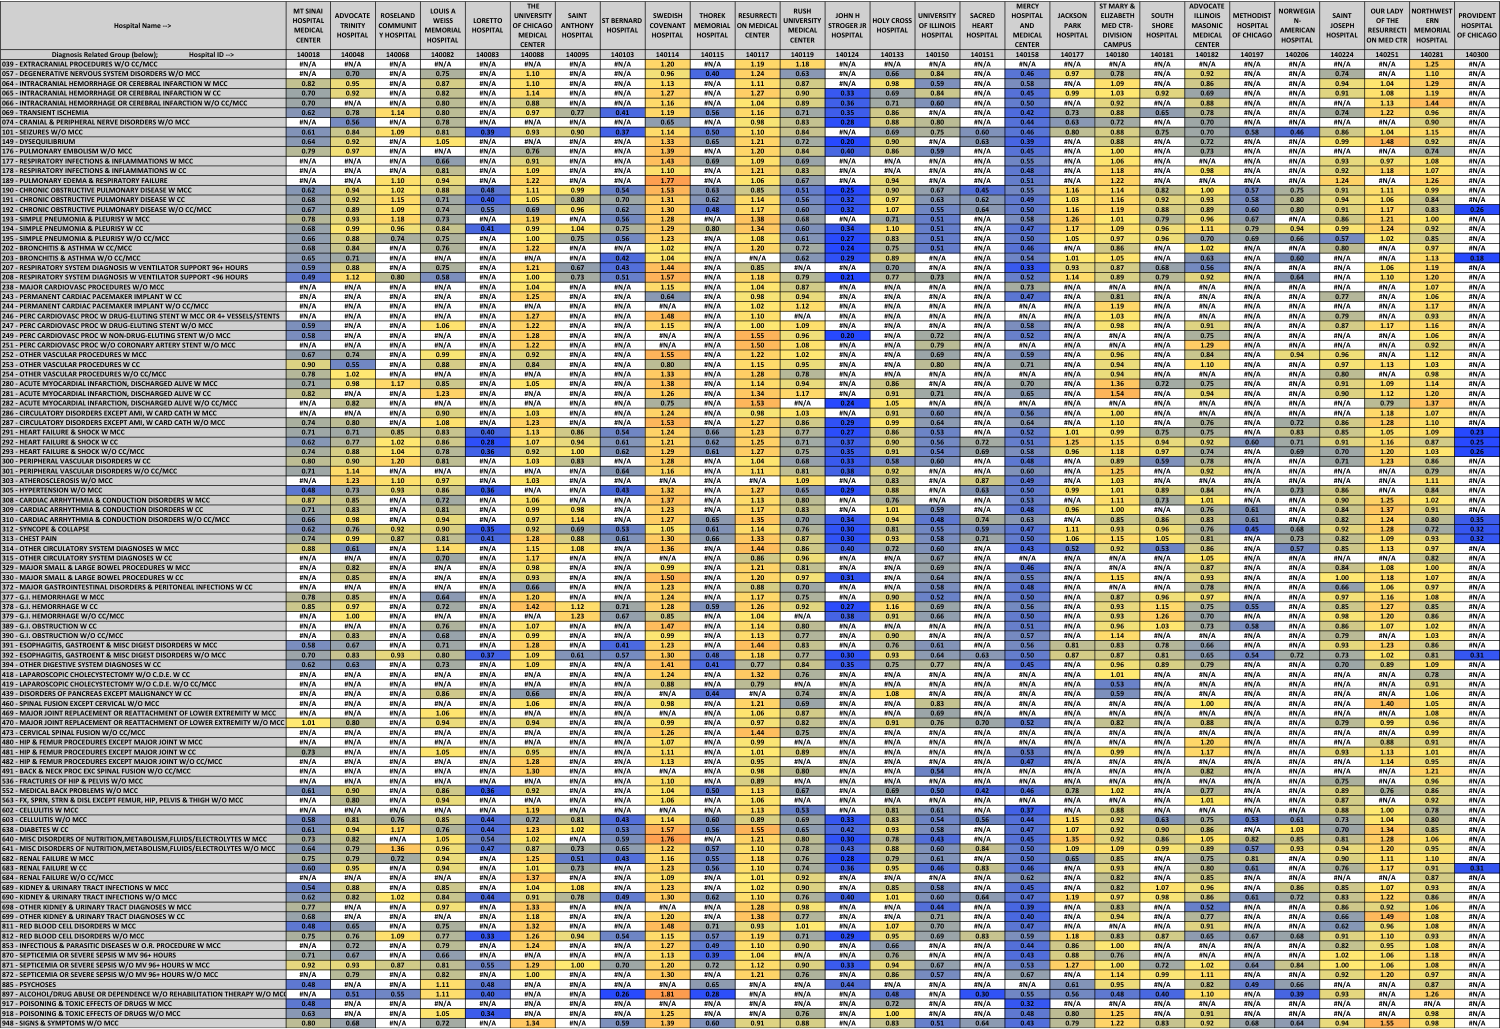 |
We made the following overarching observations about Chicago.
- Chicago is almost at part with the US average in terms of treatment costs. However, after normalization, Chicago costs appear to be lower than the US average.
- Chicago hospitals receive comparatively higher Medicare payments than the US average.
- With relatively the highest number and the lowest cost of psychoses and alcohol/drug abuse treatments, Chicago appears to be the most active in the US when it comes to psycho- and alcohol/drug abuse cases.
Is Chicago the alcohol/drug abuse and psychoses treatment capital of the US?
- Chicago accounts for 7% US discharges of alcohol/drug abuse (New York - 2.5%; Los Angeles - 0.1%; Houston - 0.2%; Philadelphia - 0.5%)
- Chicago accounts for 5.8% US discharges of psychoses (New York - 0.02%; Los Angeles - 2%; Houston - 1.1%; Philadelphia - 0.04%)
- Chicago's population is less than 1% of the US.
- Chicago has one-third of the population of New York, but almost 3 times alcohol/drug abuse cases, and almost 300 times psychoses cases.
- The cost of treating alcohol/drug abuse within Chicago can vary as much as 5 times, with Thorek Memorial Hospital charging $4,190, and Northwestern Memorial Hospital charging $20,708.
- The cost of treating psychoses within Chicago can vary as much as 3 times, with Methodist Hospital of Chicago charging $9,269, and Northwestern Memorial Hospital charging $28,032.
There may be several reasons for these observations although the CMS data itself is insufficient to draw conclusions.
- More hospitals in Chicago (17) for alcohol/drug abuse (New York - 9; Los Angeles - 2; Houston - 4; Philadelphia - 7)
- More hospitals in Chicago (11) for psychoses (New York - 1; Los Angeles - 6; Houston - 4; Philadelphia - 2)
- Cheaper treatment (50% of US average) for alcohol/drug abuse (New York - 141%; Los Angeles - 290%; Houston - 125%; Philadelphia - 168%)
- Cheaper treatment (73% of US average) for psychoses (New York - 137%; Los Angeles - 150%; Houston - 101%; Philadelphia - 354%)
- More cases of psychoses in Chicago compared to any another condition (5,244).
- Alcohol/drug abuse is the 6th most common condition (2,226 cases) in Chicago.
Selected interesting hospital-related facts:
- The University of Chicago Medical Center is the most expensive hospital in Chicago, on average charging 1.69 times relative to US average.
- The University of Illinois Hospital gets the maximum Medicare payments for the DRGs it treats, on average 1.82 times relative to the US average.
- Northwestern Memorial Hospital covers 99 out of the top 100 DRGs; that is, it can almost be a one-stop shop when it comes to treating most diseases.
- Once we normalize the hospital billing numbers, the Swedish Covenant Hospital becomes the most expensive Chicago hospital in terms of normalized hospital billing, charging 1.23 times relative to US average.
The list of all 27 hospitals sorted in descending order of their relative cost with respect to US averages is shown below (click on the header to sort by a different column):
| Hospital | DRG Coverage | Avg (Cost / USavg) | Avg (Payment / USavg) | Avg (NormCost / USavg) | Correl (Cost, Pay) |
| The University of Chicago Medical Center | 77 | 1.69 | 1.58 | 1.08 | 0.40 |
| Swedish Covenant Hospital | 88 | 1.44 | 1.19 | 1.23 | 0.35 |
| Northwestern Memorial Hospital | 99 | 1.32 | 1.31 | 1.00 | 0.69 |
| St Mary & Elizabeth Med Ctr-Division Campus | 82 | 1.27 | 1.30 | 0.98 | 0.41 |
| Advocate Illinois Masonic Medical Center | 77 | 1.22 | 1.43 | 0.86 | 0.47 |
| Jackson Park Hospital | 39 | 1.21 | 1.24 | 0.97 | 0.53 |
| Rush University Medical Center | 87 | 1.19 | 1.47 | 0.81 | 0.45 |
| Roseland Community Hospital | 28 | 1.18 | 1.18 | 0.99 | 0.42 |
| University of Illinois Hospital | 62 | 1.14 | 1.82 | 0.62 | 0.57 |
| Resurrection Medical Center | 93 | 1.13 | 1.00 | 1.14 | 0.42 |
| Saint Anthony Hospital | 30 | 1.09 | 1.23 | 0.89 | 0.43 |
| Our Lady of the Resurrection Med Ctr | 67 | 1.08 | 0.96 | 1.14 | 0.51 |
| Saint Joseph Hospital | 71 | 1.03 | 1.20 | 0.86 | 0.45 |
| Mt Sinai Hospital Medical Center | 63 | 1.00 | 1.45 | 0.69 | 0.61 |
| Louis A Weiss Memorial Hospital | 72 | 0.99 | 1.16 | 0.85 | 0.49 |
| Norwegian-American Hospital | 29 | 0.95 | 1.29 | 0.73 | 0.58 |
| South Shore Hospital | 40 | 0.93 | 1.08 | 0.86 | 0.73 |
| Advocate Trinity Hospital | 65 | 0.89 | 1.06 | 0.84 | 0.37 |
| Holy Cross Hospital | 67 | 0.87 | 1.00 | 0.86 | 0.59 |
| Sacred Heart Hospital | 22 | 0.82 | 1.26 | 0.65 | 0.55 |
| Methodist Hospital of Chicago | 24 | 0.70 | 1.12 | 0.62 | 0.65 |
| St Bernard Hospital | 32 | 0.69 | 1.26 | 0.54 | 0.64 |
| Mercy Hospital and Medical Center | 82 | 0.64 | 1.27 | 0.51 | 0.61 |
| Thorek Memorial Hospital | 34 | 0.64 | 1.12 | 0.57 | 0.65 |
| John H Stroger Jr Hospital | 42 | 0.51 | 1.60 | 0.32 | 0.68 |
| Loretto Hospital | 23 | 0.49 | 1.18 | 0.42 | 0.39 |
| Provident Hospital of Chicago | 10 | 0.33 | 1.18 | 0.28 | 0.45 |
Below is the list of all 100 DRGs sorted in descending order of the variation in their cost within Chicago (click on the header to sort by a different column):
| DRG Definition | #Hospitals | %USdischarges | %USavgCost | %USavgPay | %USavgNormCost | VariationInCost (Stddev/Avg) | Correlation (Cost, Pay) |
| 897 - Alcohol/Drug Abuse or Dependence w/o Rehabilitation Therapy w/o Mcc | 17 | 6.97% | 50.21% | 110.23% | 35.47% | 0.63 | 0.22 |
| 698 - Other Kidney & Urinary Tract Diagnoses w Mcc | 12 | 1.74% | 115.21% | 120.22% | 93.07% | 0.60 | 0.80 |
| 811 - Red Blood Cell Disorders w Mcc | 15 | 1.57% | 108.81% | 124.59% | 84.86% | 0.47 | 0.66 |
| 207 - Respiratory System Diagnosis w Ventilator Support 96+ Hours | 16 | 1.16% | 90.90% | 111.01% | 80.83% | 0.44 | 0.49 |
| 282 - Acute Myocardial Infarction, Discharged Alive w/o Cc/Mcc | 7 | 0.47% | 119.69% | 133.21% | 87.15% | 0.43 | 0.30 |
| 870 - Septicemia or Severe Sepsis w Mv 96+ Hours | 13 | 1.54% | 89.11% | 103.08% | 83.09% | 0.43 | 0.70 |
| 853 - Infectious & Parasitic Diseases w O.R. Procedure w Mcc | 14 | 1.15% | 97.29% | 105.42% | 92.59% | 0.42 | 0.78 |
| 885 - Psychoses | 11 | 5.84% | 72.93% | 109.27% | 60.40% | 0.40 | 0.66 |
| 203 - Bronchitis & Asthma w/o Cc/Mcc | 14 | 1.71% | 94.27% | 124.87% | 73.00% | 0.40 | 0.07 |
| 682 - Renal Failure w Mcc | 22 | 1.02% | 108.57% | 128.29% | 83.87% | 0.39 | 0.42 |
| 291 - Heart Failure & Shock w Mcc | 25 | 0.87% | 108.84% | 122.69% | 93.32% | 0.38 | 0.40 |
| 202 - Bronchitis & Asthma w Cc/Mcc | 15 | 1.02% | 118.79% | 141.79% | 83.52% | 0.38 | 0.39 |
| 640 - Misc Disorders of Nutrition,Metabolism,Fluids/Electrolytes w Mcc | 22 | 1.44% | 110.54% | 124.12% | 86.31% | 0.38 | 0.18 |
| 208 - Respiratory System Diagnosis w Ventilator Support <96 Hours | 21 | 0.83% | 103.57% | 123.78% | 82.76% | 0.38 | 0.19 |
| 249 - Perc Cardiovasc Proc w Non-Drug-Eluting Stent w/o Mcc | 9 | 0.49% | 124.16% | 142.23% | 80.77% | 0.37 | -0.37 |
| 074 - Cranial & Peripheral Nerve Disorders w/o Mcc | 13 | 1.56% | 102.77% | 135.40% | 73.51% | 0.37 | 0.68 |
| 314 - Other Circulatory System Diagnoses w Mcc | 20 | 1.37% | 112.94% | 127.78% | 86.02% | 0.36 | 0.34 |
| 391 - Esophagitis, Gastroent & Misc Digest Disorders w Mcc | 18 | 1.17% | 109.59% | 129.82% | 81.24% | 0.36 | 0.52 |
| 190 - Chronic Obstructive Pulmonary Disease w Mcc | 26 | 0.77% | 111.73% | 125.63% | 92.16% | 0.36 | 0.21 |
| 305 - Hypertension w/o Mcc | 20 | 1.92% | 95.39% | 122.49% | 74.90% | 0.36 | 0.04 |
| 394 - Other Digestive System Diagnoses w Cc | 18 | 1.05% | 106.96% | 127.53% | 80.49% | 0.35 | 0.34 |
| 482 - Hip & Femur Procedures Except Major Joint w/o Cc/Mcc | 6 | 0.60% | 115.11% | 116.44% | 97.84% | 0.35 | 0.40 |
| 812 - Red Blood Cell Disorders w/o Mcc | 26 | 1.49% | 107.58% | 133.34% | 81.67% | 0.34 | 0.38 |
| 189 - Pulmonary Edema & Respiratory Failure | 11 | 0.25% | 134.56% | 125.29% | 100.71% | 0.34 | 0.48 |
| 292 - Heart Failure & Shock w Cc | 27 | 1.01% | 112.46% | 132.09% | 88.68% | 0.34 | 0.17 |
| 243 - Permanent Cardiac Pacemaker Implant w Cc | 8 | 0.47% | 110.92% | 128.26% | 85.16% | 0.34 | 0.43 |
| 603 - Cellulitis w/o Mcc | 26 | 1.01% | 95.39% | 126.29% | 78.75% | 0.34 | 0.51 |
| 057 - Degenerative Nervous System Disorders w/o Mcc | 15 | 1.19% | 97.01% | 118.25% | 79.06% | 0.33 | 0.58 |
| 392 - Esophagitis, Gastroent & Misc Digest Disorders w/o Mcc | 27 | 0.96% | 101.62% | 131.60% | 80.32% | 0.33 | 0.27 |
| 378 - G.I. Hemorrhage w Cc | 21 | 0.73% | 121.45% | 127.08% | 96.38% | 0.33 | 0.18 |
| 948 - Signs & Symptoms w/o Mcc | 22 | 1.37% | 108.85% | 126.56% | 83.64% | 0.33 | 0.23 |
| 390 - G.I. Obstruction w/o Cc/Mcc | 11 | 0.73% | 122.35% | 131.65% | 91.92% | 0.33 | 0.79 |
| 313 - Chest Pain | 26 | 1.28% | 100.84% | 122.30% | 78.66% | 0.32 | 0.07 |
| 684 - Renal Failure w/o Cc/Mcc | 8 | 0.66% | 117.97% | 125.66% | 90.54% | 0.32 | 0.62 |
| 312 - Syncope & Collapse | 27 | 1.24% | 95.71% | 121.28% | 77.93% | 0.32 | 0.07 |
| 638 - Diabetes w Cc | 24 | 1.45% | 101.35% | 120.39% | 81.58% | 0.32 | -0.10 |
| 329 - Major Small & Large Bowel Procedures w Mcc | 11 | 0.75% | 121.70% | 131.71% | 91.79% | 0.32 | 0.77 |
| 918 - Poisoning & Toxic Effects Of Drugs w/o Mcc | 11 | 0.79% | 109.64% | 124.48% | 85.24% | 0.32 | 0.05 |
| 871 - Septicemia or Severe Sepsis w/o Mv 96+ Hours w Mcc | 25 | 0.82% | 112.37% | 115.18% | 102.12% | 0.31 | 0.37 |
| 439 - Disorders of Pancreas Except Malignancy w Cc | 7 | 0.72% | 111.08% | 138.80% | 76.01% | 0.31 | 0.62 |
| 293 - Heart Failure & Shock w/o Cc/Mcc | 26 | 1.16% | 106.04% | 131.66% | 81.36% | 0.31 | 0.14 |
| 192 - Chronic Obstructive Pulmonary Disease w/o Cc/Mcc | 27 | 1.00% | 102.23% | 127.93% | 81.32% | 0.31 | 0.02 |
| 065 - Intracranial Hemorrhage or Cerebral Infarction w Cc | 18 | 0.75% | 118.90% | 127.87% | 95.23% | 0.31 | 0.34 |
| 286 - Circulatory Disorders Except Ami, w Card Cath w Mcc | 11 | 1.12% | 125.82% | 129.94% | 95.16% | 0.31 | 0.68 |
| 064 - Intracranial Hemorrhage or Cerebral Infarction w Mcc | 15 | 0.83% | 123.39% | 125.49% | 99.07% | 0.31 | 0.66 |
| 310 - Cardiac Arrhythmia & Conduction Disorders w/o Cc/Mcc | 22 | 0.70% | 115.75% | 132.00% | 87.90% | 0.31 | 0.09 |
| 917 - Poisoning & Toxic Effects of Drugs w Mcc | 3 | 0.21% | 57.42% | 115.95% | 48.00% | 0.31 | -0.08 |
| 149 - Dysequilibrium | 16 | 1.53% | 95.59% | 116.54% | 78.10% | 0.30 | -0.47 |
| 101 - Seizures w/o Mcc | 25 | 1.63% | 96.26% | 119.94% | 77.60% | 0.30 | 0.31 |
| 246 - Perc Cardiovasc Proc w Drug-Eluting Stent w Mcc Or 4+ Vessels/Stents | 6 | 0.51% | 153.32% | 134.18% | 109.05% | 0.30 | 0.71 |
| 330 - Major Small & Large Bowel Procedures w Cc | 13 | 0.80% | 130.93% | 134.86% | 93.87% | 0.30 | 0.15 |
| 377 - G.I. Hemorrhage w Mcc | 16 | 0.96% | 110.98% | 121.12% | 89.75% | 0.30 | 0.43 |
| 699 - Other Kidney & Urinary Tract Diagnoses w Cc | 12 | 1.75% | 109.79% | 120.28% | 87.49% | 0.30 | 0.21 |
| 177 - Respiratory Infections & Inflammations w Mcc | 11 | 0.54% | 111.90% | 117.84% | 96.92% | 0.30 | 0.36 |
| 069 - Transient Ischemia | 21 | 0.89% | 103.29% | 127.43% | 82.27% | 0.29 | 0.12 |
| 683 - Renal Failure w Cc | 21 | 0.81% | 100.98% | 126.23% | 80.54% | 0.29 | -0.05 |
| 066 - Intracranial Hemorrhage Or Cerebral Infarction w/o Cc/Mcc | 14 | 0.71% | 122.66% | 137.55% | 88.14% | 0.29 | 0.19 |
| 191 - Chronic Obstructive Pulmonary Disease w Cc | 26 | 0.86% | 106.64% | 124.63% | 88.36% | 0.29 | 0.03 |
| 193 - Simple Pneumonia & Pleurisy w Mcc | 20 | 0.53% | 118.64% | 125.92% | 95.13% | 0.29 | 0.23 |
| 552 - Medical Back Problems w/o Mcc | 19 | 1.03% | 99.76% | 129.59% | 76.05% | 0.29 | 0.28 |
| 280 - Acute Myocardial Infarction, Discharged Alive w Mcc | 16 | 0.77% | 116.95% | 115.67% | 100.71% | 0.28 | 0.60 |
| 247 - Perc Cardiovasc Proc w Drug-Eluting Stent w/o Mcc | 12 | 0.47% | 141.88% | 141.48% | 91.52% | 0.28 | 0.68 |
| 300 - Peripheral Vascular Disorders w Cc | 19 | 1.40% | 103.30% | 131.10% | 77.62% | 0.28 | 0.19 |
| 308 - Cardiac Arrhythmia & Conduction Disorders w Mcc | 15 | 0.76% | 114.78% | 120.02% | 93.59% | 0.28 | 0.57 |
| 287 - Circulatory Disorders Except Ami, w Card Cath w/o Mcc | 17 | 0.74% | 131.11% | 134.59% | 92.56% | 0.28 | -0.08 |
| 389 - G.I. Obstruction w Cc | 13 | 0.73% | 115.59% | 122.12% | 93.40% | 0.28 | 0.34 |
| 690 - Kidney & Urinary Tract Infections w/o Mcc | 26 | 0.88% | 109.62% | 129.48% | 90.18% | 0.27 | 0.11 |
| 641 - Misc Disorders of Nutrition,Metabolism,Fluids/Electrolytes w/o Mcc | 26 | 1.17% | 110.24% | 131.14% | 87.20% | 0.27 | 0.19 |
| 602 - Cellulitis w Mcc | 10 | 1.17% | 94.05% | 117.06% | 79.26% | 0.27 | 0.04 |
| 315 - Other Circulatory System Diagnoses w Cc | 7 | 1.05% | 130.71% | 144.91% | 87.34% | 0.27 | 0.62 |
| 301 - Peripheral Vascular Disorders w/o Cc/Mcc | 12 | 1.46% | 109.28% | 135.59% | 78.89% | 0.26 | -0.20 |
| 176 - Pulmonary Embolism w/o Mcc | 13 | 0.84% | 104.84% | 135.08% | 74.94% | 0.26 | -0.13 |
| 480 - Hip & Femur Procedures Except Major Joint w Mcc | 5 | 0.44% | 114.94% | 115.67% | 98.99% | 0.25 | 0.84 |
| 194 - Simple Pneumonia & Pleurisy w Cc | 25 | 0.62% | 116.20% | 127.38% | 93.13% | 0.25 | -0.27 |
| 195 - Simple Pneumonia & Pleurisy w/o Cc/Mcc | 23 | 0.68% | 104.29% | 131.60% | 79.58% | 0.25 | -0.12 |
| 303 - Atherosclerosis w/o Mcc | 10 | 0.63% | 123.26% | 123.62% | 96.89% | 0.25 | 0.53 |
| 491 - Back & Neck Proc Exc Spinal Fusion w/o Cc/Mcc | 6 | 0.59% | 140.76% | 140.24% | 93.83% | 0.24 | 0.06 |
| 481 - Hip & Femur Procedures Except Major Joint w Cc | 12 | 0.46% | 123.20% | 126.57% | 95.29% | 0.23 | 0.62 |
| 178 - Respiratory Infections & Inflammations w Cc | 11 | 0.58% | 120.09% | 121.24% | 100.40% | 0.23 | 0.40 |
| 253 - Other Vascular Procedures w Cc | 14 | 0.87% | 120.31% | 130.19% | 87.86% | 0.23 | 0.74 |
| 379 - G.I. Hemorrhage w/o Cc/Mcc | 15 | 1.09% | 101.48% | 123.85% | 81.55% | 0.23 | -0.19 |
| 372 - Major Gastrointestinal Disorders & Peritoneal Infections w Cc | 10 | 0.83% | 96.70% | 125.91% | 76.23% | 0.23 | 0.26 |
| 281 - Acute Myocardial Infarction, Discharged Alive w Cc | 13 | 0.60% | 129.18% | 124.76% | 99.71% | 0.22 | 0.21 |
| 419 - Laparoscopic Cholecystectomy w/o C.D.E. w/o Cc/Mcc | 4 | 0.51% | 113.90% | 142.85% | 77.96% | 0.22 | 0.41 |
| 689 - Kidney & Urinary Tract Infections w Mcc | 18 | 0.92% | 107.08% | 122.31% | 87.78% | 0.21 | 0.25 |
| 309 - Cardiac Arrhythmia & Conduction Disorders w Cc | 18 | 0.79% | 114.98% | 126.68% | 89.53% | 0.21 | 0.23 |
| 252 - Other Vascular Procedures w Mcc | 14 | 1.17% | 118.13% | 122.72% | 93.68% | 0.21 | -0.01 |
| 536 - Fractures Of Hip & Pelvis w/o Mcc | 4 | 0.38% | 105.02% | 113.10% | 93.16% | 0.21 | 0.71 |
| 473 - Cervical Spinal Fusion w/o Cc/Mcc | 4 | 0.46% | 130.55% | 134.87% | 94.43% | 0.21 | 0.09 |
| 872 - Septicemia or Severe Sepsis w/o Mv 96+ Hours w/o Mcc | 15 | 0.58% | 120.04% | 118.27% | 102.18% | 0.20 | 0.24 |
| 470 - Major Joint Replacement or Reattachment of Lower Extremity w/o Mcc | 16 | 0.62% | 115.87% | 131.63% | 84.64% | 0.19 | 0.60 |
| 039 - Extracranial Procedures w/o Cc/Mcc | 4 | 0.32% | 153.58% | 126.48% | 113.95% | 0.19 | 0.99 |
| 469 - Major Joint Replacement or Reattachment of Lower Extremity w Mcc | 5 | 0.51% | 116.20% | 124.29% | 90.71% | 0.17 | 0.84 |
| 238 - Major Cardiovasc Procedures w/o Mcc | 6 | 0.62% | 121.45% | 124.76% | 92.98% | 0.17 | 0.68 |
| 244 - Permanent Cardiac Pacemaker Implant w/o Cc/Mcc | 4 | 0.24% | 131.11% | 117.90% | 107.23% | 0.17 | 0.96 |
| 563 - Fx, Sprn, Strn & Disl Except Femur, Hip, Pelvis & Thigh w/o Mcc | 7 | 0.72% | 107.55% | 112.14% | 92.19% | 0.16 | 0.79 |
| 251 - Perc Cardiovasc Proc w/o Coronary Artery Stent w/o Mcc | 6 | 0.51% | 143.95% | 132.22% | 107.33% | 0.14 | 0.15 |
| 254 - Other Vascular Procedures w/o Cc/Mcc | 8 | 0.52% | 115.32% | 118.55% | 90.89% | 0.13 | -0.11 |
| 460 - Spinal Fusion Except Cervical w/o Mcc | 8 | 0.63% | 122.47% | 136.35% | 87.96% | 0.12 | -0.05 |
| 418 - Laparoscopic Cholecystectomy w/o C.D.E. w Cc | 5 | 0.42% | 131.63% | 132.86% | 98.26% | 0.09 | 0.57 |